Labor productivity tracking that keeps the office in step with the field.
Know how every crew is pacing against its labor budget without calling the jobsite. The daily report shows what was installed, SitewideOps compares it with the hours you budgeted, and the office sees whether each job is on pace long before the hours hit job cost.
21 days free. No credit card.
 Live product · Not a mockup
Everything on this page is in the software today.
- Every feature live today
- Syncs with QuickBooks Online and Sage Intacct
- One price, no tiers
By the time I see the job cost report, the hours are already spent.
Most contractors learn a job lost money when the hours hit payroll or the WIP schedule closes at month end. By then most of the hours are spent, and the loss is locked in. Daily reports from the SitewideOps Field app keep the office and the field in sync, so you know each day whether the work is keeping pace with the estimate. Whether it's weather, a late delivery, or a short-handed crew, you see the slowdown while there's still time to fix it.
When do you find out a job is falling off track?
Every day you don't know is another day of lost hours you can't get back.
Lost hours 600-hour job, 10% behind the estimate
0hrsby day 30
How SitewideOps keeps every job on PACE.
PACE stands for Productivity And Crew Efficiency. It's how SitewideOps measures each day's installed work against your labor budget.
Installed work is logged in the daily report in the Field app
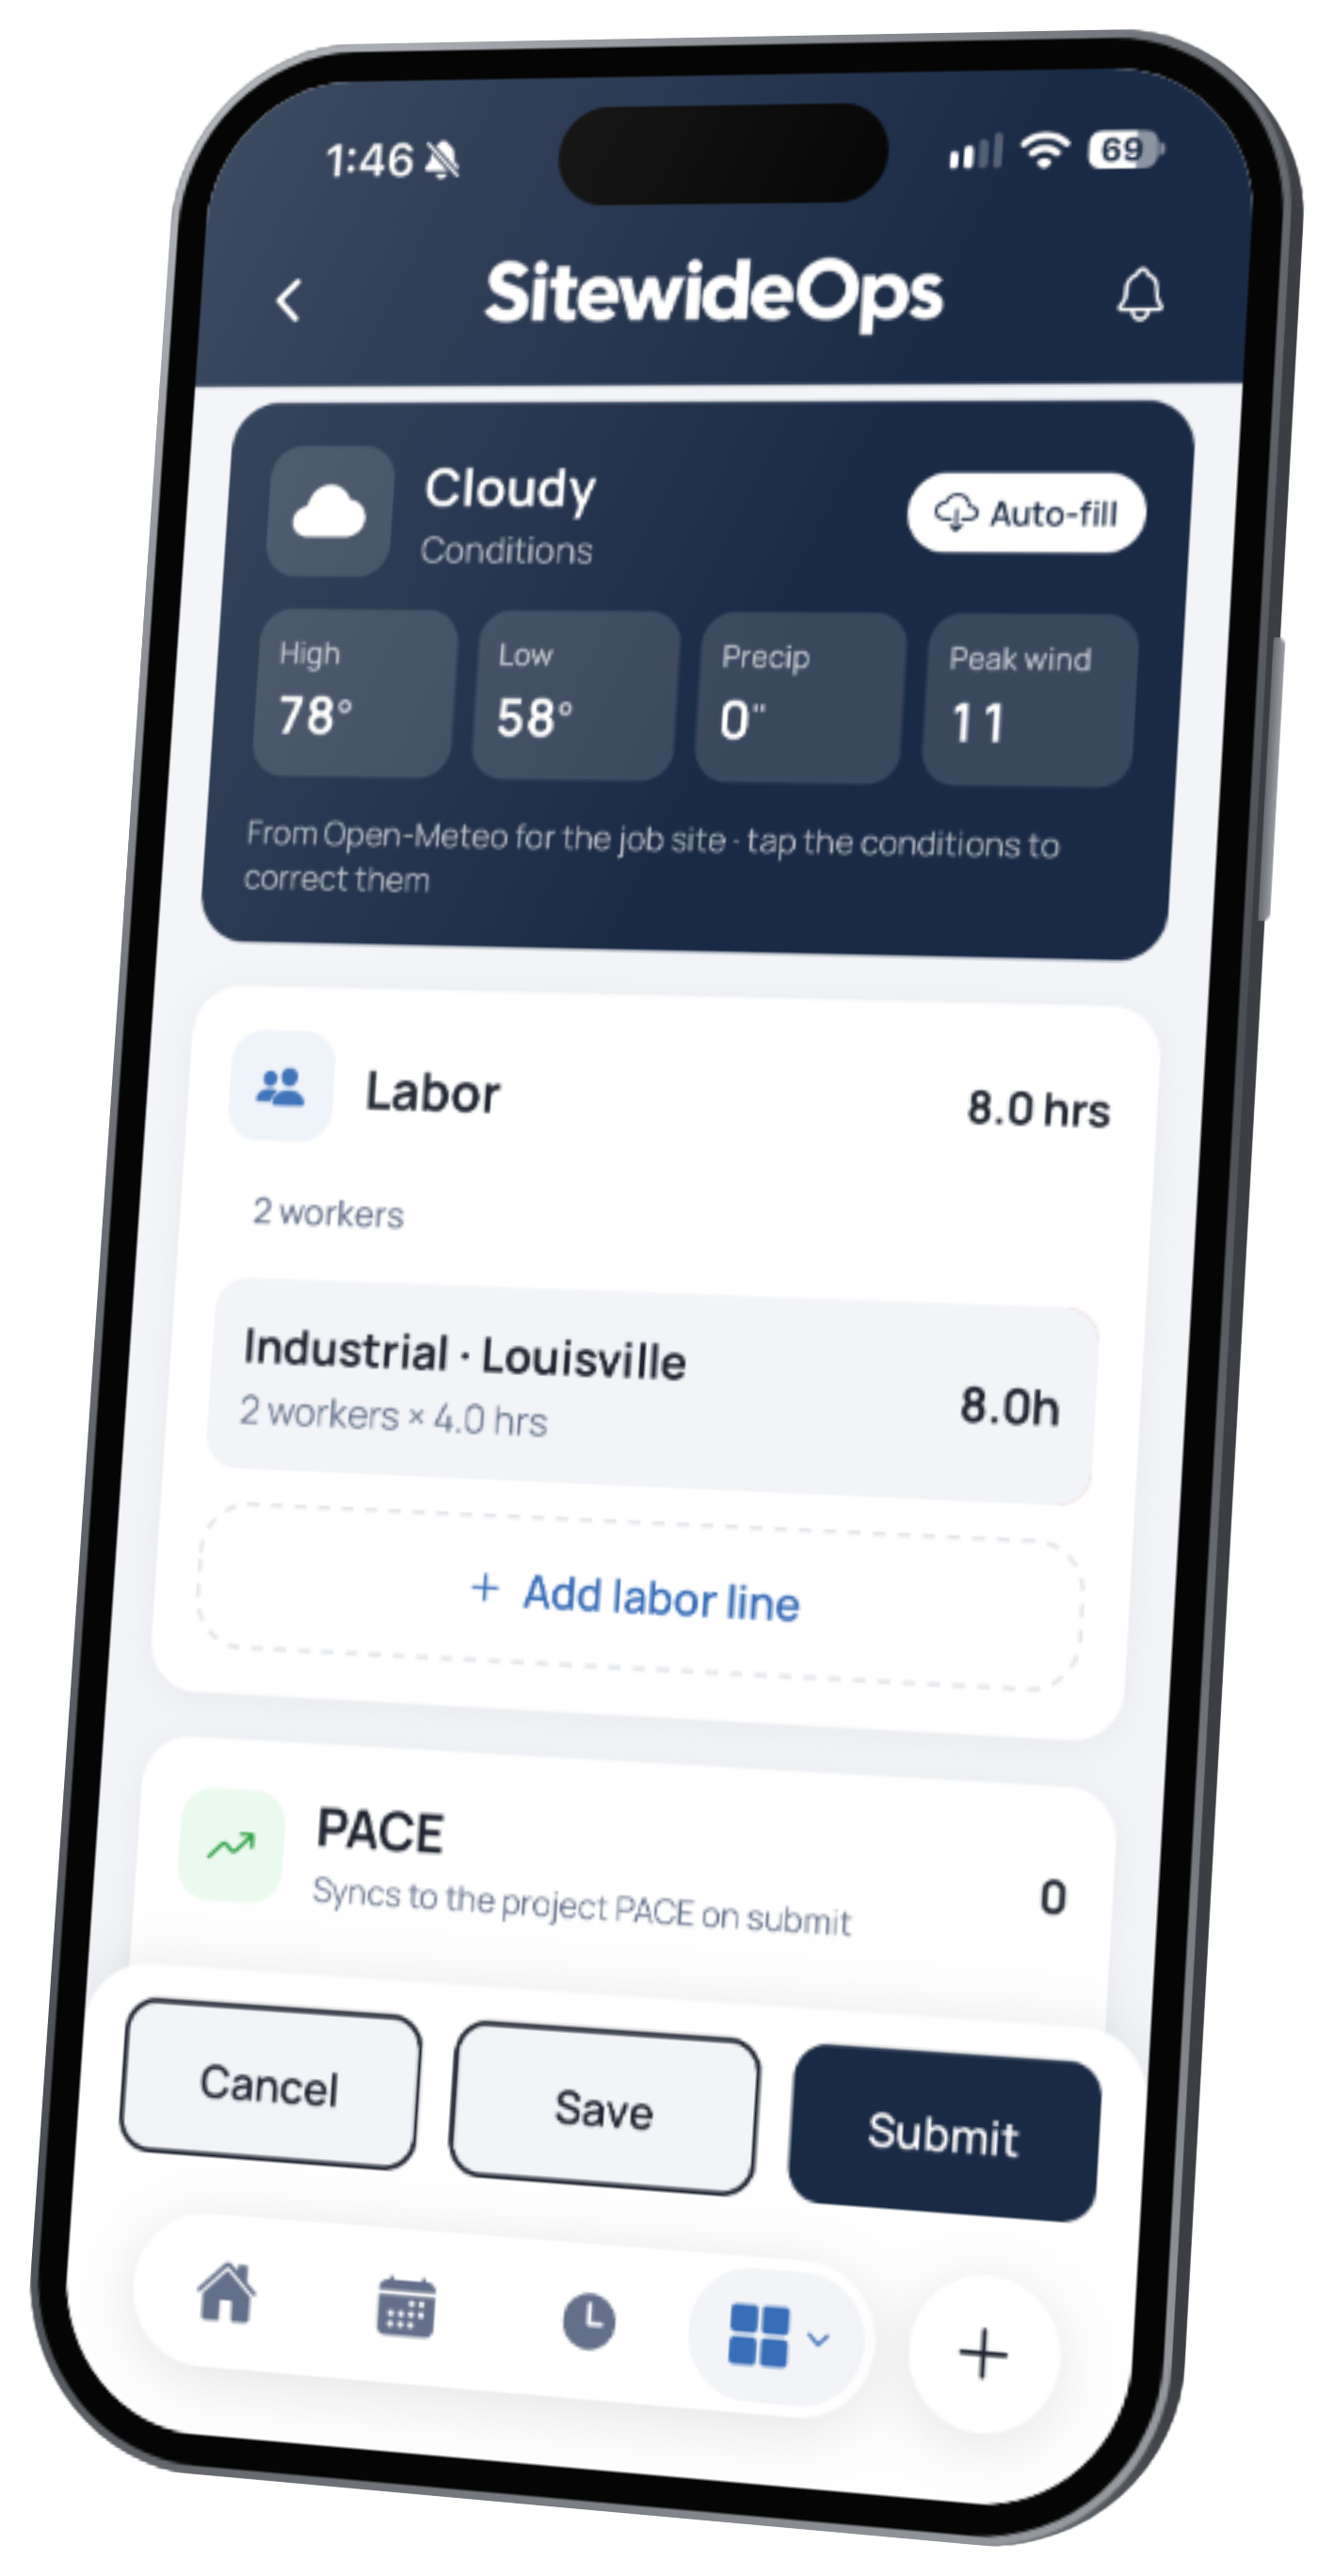
The field team adds the day's labor hours, then logs what they installed in the PACE section and applies those hours to it. When the report is submitted, it syncs to the project. No extra paperwork.
- Labor hours: who worked and for how long
- PACE entries: what was installed, and how much
- Hours applied: labor hours matched to each entry
- SitewideOps does the rest.
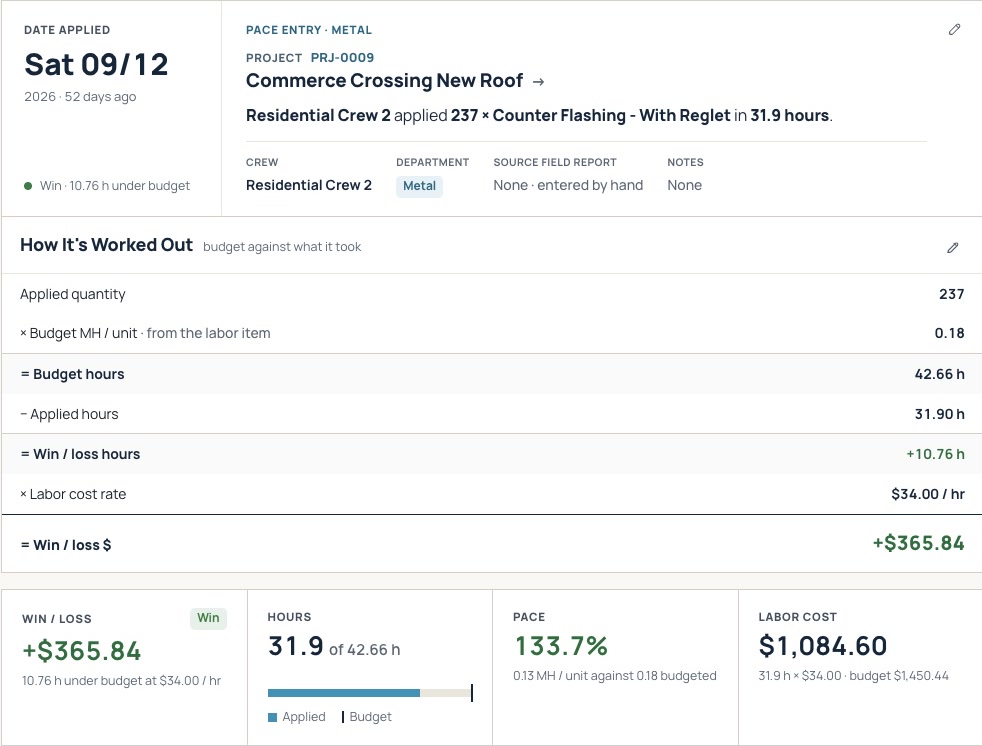
Every entry is checked against your budget
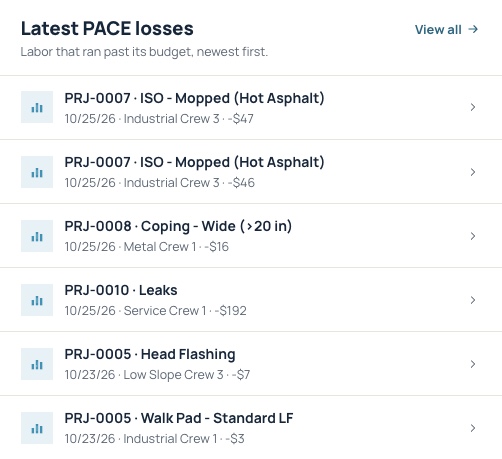
SitewideOps compares each entry with the hours you budgeted for that work and shows the result that same day, in hours and in dollars. You know right away whether a job is ahead or behind.
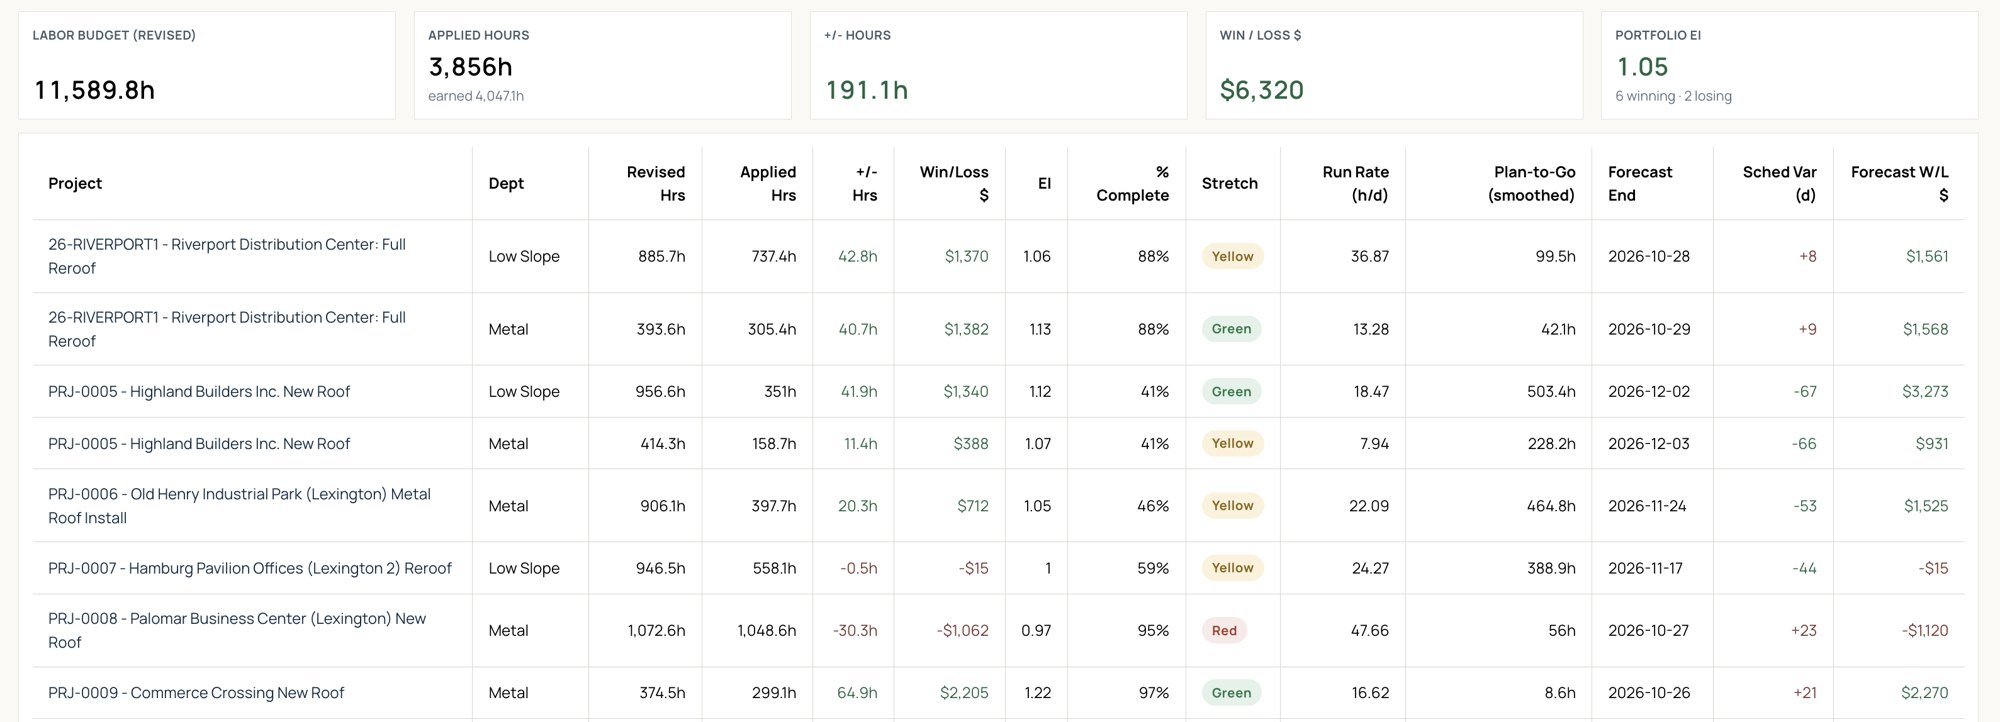
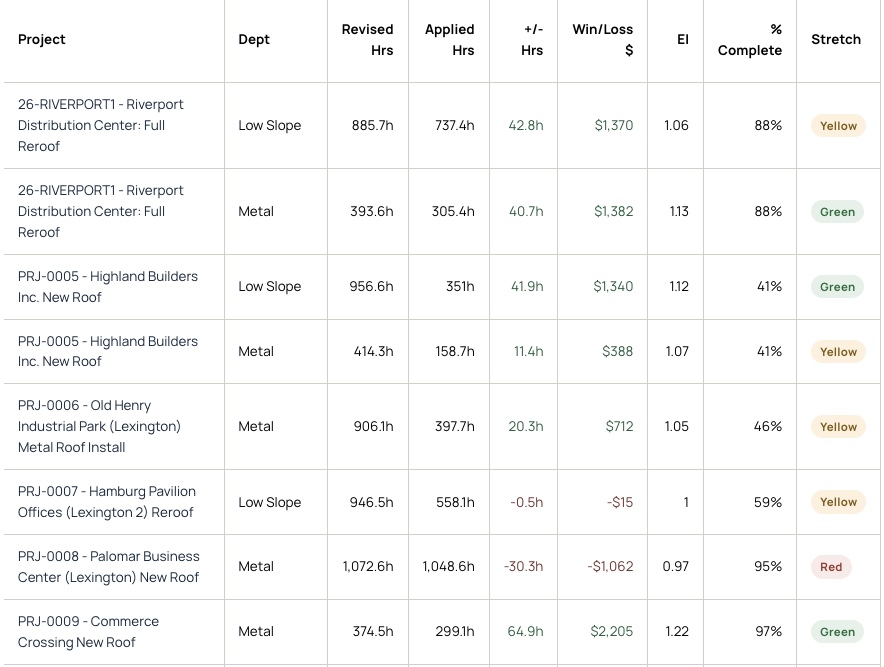
See every job and department on one screen
Each job and department shows hours won or lost, dollars won or lost, percent complete, and a status color: green, yellow, or red. At the current pace, SitewideOps also forecasts the finish date and the final win or loss, so you know which jobs need you this week.
Catch losses as they happen
Your project managers see each day a job falls behind its labor budget as soon as the daily report is in, so they can get the job back on track before the loss adds up.
Simple pricing
Try it on one of your jobs
and see if it's on PACE.
$90 per active user per month
Time-clock-only users are free
See pricing details →
“I ran operations at a commercial roofing company and kept waiting for software that could keep up with the job, with leading performance indicators from the field before it hits the P&L. It never showed up. So I built it.”
Garrett Henke · Founder, SitewideOps · former COO of a multi-branch commercial roofing contractor
Part of one job record, not another app to check.
Questions about labor productivity
I already track job costs. Why do I need this?
Job costing tells you what a job cost after the hours are paid. Labor productivity compares each day's installed work with the budget, so you see a job falling off track while you can still change the outcome.
What has to be entered?
The material, quantity installed, and hours worked are entered in the daily report on the Field app.
What does the efficiency index mean?
It's the hours the budget allowed for the work installed, divided by the hours actually worked. 1.0 means on budget. Above 1.0 means the crew is ahead, and below 1.0 means they're behind. On each entry, the same number shows as a PACE percentage, where 100% is on budget.
Can I track productivity by crew?
Yes. Each entry is tied to the crew that did the work, so you can see any crew's hours, quantity installed, and dollars won or lost across all your jobs.
Does it work for my trade?
Yes. You set up your own labor items and units, such as squares, linear feet, or each, so the numbers match how your trade measures work.